The honest picture of AI automation in 2026 fits in four sentences. Roughly 1 in 4 people online uses a standalone AI tool monthly, about 1.5% pay for any AI product and only 0.1 to 0.2% pay for tools that build anything. Over half of US firms buy AI while measurable ROI sits at 7% and falling. The projects that fail do not fail on model capability, they fail on integration, process definition and run cost. Almost every viral number you have seen about this industry is wrong in a checkable way.
Last verified: August 2026. Every figure below carries its metric, date and named source. Where a famous number is wrong, the debunk table says exactly why.
I am Prem Patel, founder of Nex Automations. I hold the Make Level 5 Expert certification, we are a listed Make Silver Partner and Zapier Solution Partner, and over 6 years we have shipped 1,200+ automations for 210+ clients. This report exists because I kept watching the same wrong numbers travel through LinkedIn, sales decks and client briefs, and because the verified numbers tell a more useful story than the hype does: they tell you exactly where automation pays and where it burns money.
The honest funnel: who uses, who pays, who builds
Start with the number the "everyone is doing AI" posts never show.
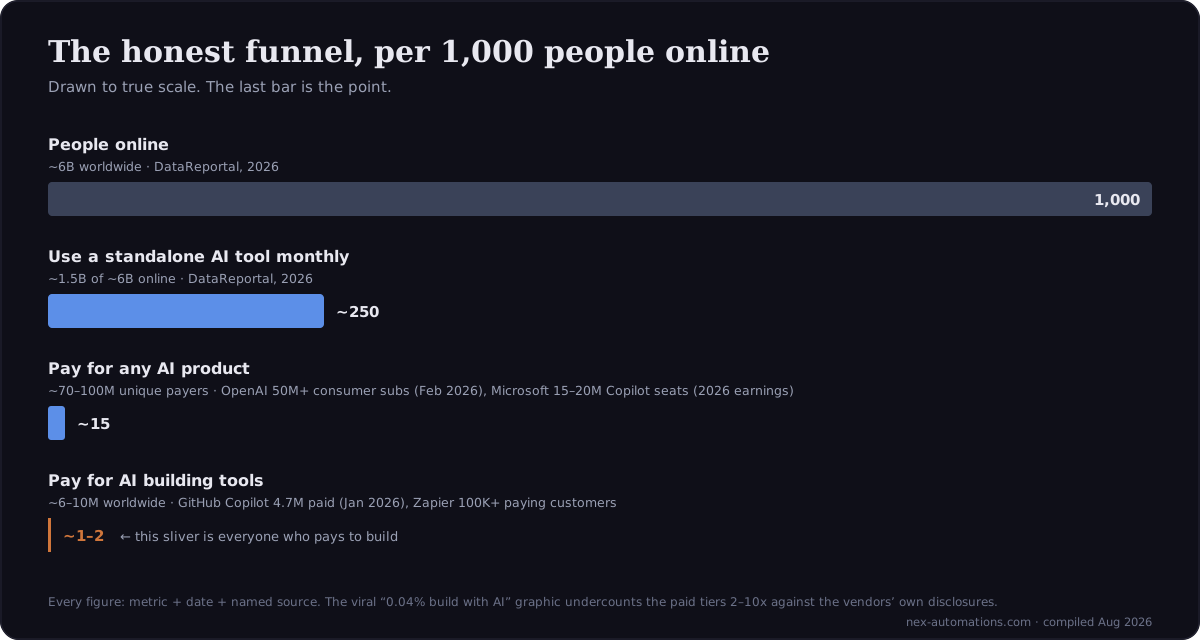
| Layer | People | Share of connected | Source, date |
|---|---|---|---|
| Online | ~6B | 100% | DataReportal Digital 2026 |
| Use a standalone AI tool monthly | ~1.5B | ~25% | DataReportal Digital 2026 |
| Use AI daily | 500 to 600M | ~9% | Menlo Ventures, Apr 2025 |
| Pay for any AI product | ~70 to 100M | ~1.5% | OpenAI (50M+ consumer subs, Feb 27, 2026), Microsoft earnings (15 to 20M Copilot seats, 2026) |
| Pay for AI building tools | ~6 to 10M | ~0.1 to 0.2% | GitHub Copilot 4.7M paid (Microsoft earnings, Jan 2026), Zapier 100K+ paying customers |
The conversion ratios are remarkably consistent wherever a vendor discloses both sides. ChatGPT: 50M+ paid consumer subscriptions against 900M+ weekly active users, about 5.6% (both figures OpenAI official, Feb 27, 2026). Microsoft 365 Copilot: 15M paid seats against 450M commercial seats in January 2026, 3.3% (Microsoft earnings). Zapier: 100K+ paying customers against 3M+ users, about 3.3%. Whatever the product, usage is an ocean and payment is a pond.
India makes the gap vivid. India is ChatGPT's second-largest market by weekly active users at about 100M (Sam Altman, Feb 15, 2026) and drives roughly 20% of global GenAI app downloads, yet accounts for about 1% of GenAI in-app purchases (TechCrunch, Feb 24, 2026). Enormous use, thin payment. If you sell automation, the payer pool is your market, not the user pool, and the payer pool is small, concentrated and increasingly well funded per head.
Two adoption numbers, both true, 2.6x apart
Ask "what share of US businesses use AI in 2026" and you can honestly answer 55.7% or 21.6%.
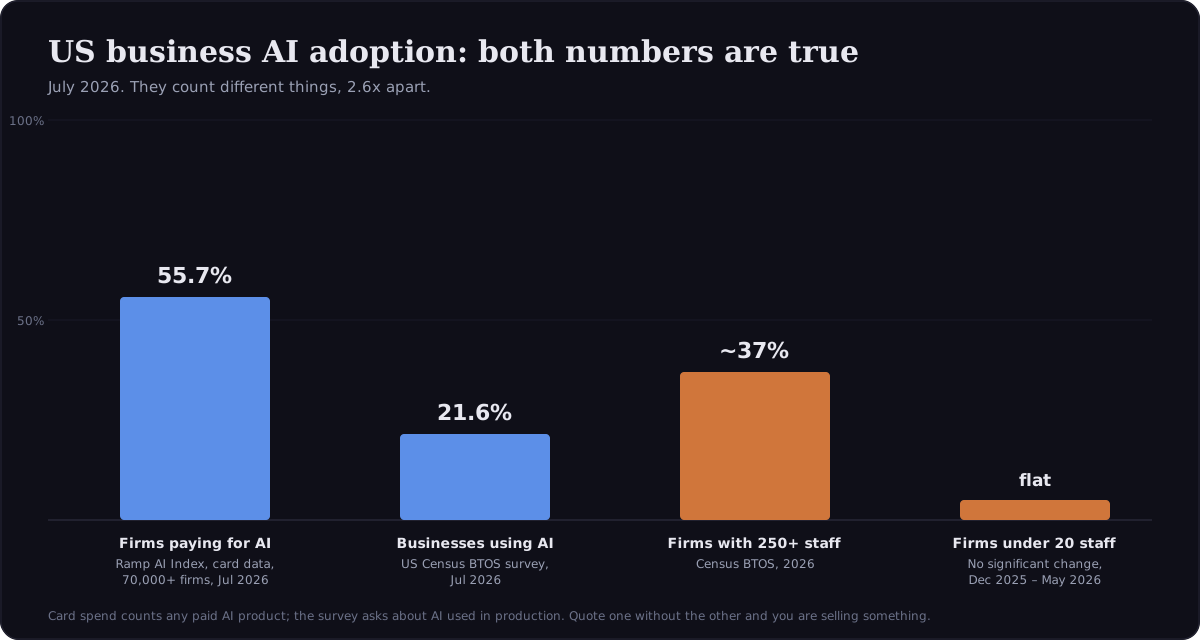
The Ramp AI Index reads card transactions across 70,000+ US firms and finds 55.7% paying for AI products (July 2026). The US Census Bureau's Business Trends and Outlook Survey asks businesses whether they use AI to produce goods and services and finds 21.6% (July 2026). Neither is wrong. One counts an AI line item on the company card, the other asks whether AI is actually in production. The 2.6x gap between them is, roughly, the population that bought something and has not made it work.
The split by size matters more than the average. Census-measured adoption among firms with 250+ employees is around 37% and climbing; among firms with fewer than 20 employees it showed no significant change from December 2025 to May 2026. The small-business wave everyone forecasts is, so far, not in the data. What is in the data is a large-firm population deploying fast and struggling to convert deployment into return, which brings us to the report's central chart.
Deployment and return have decoupled
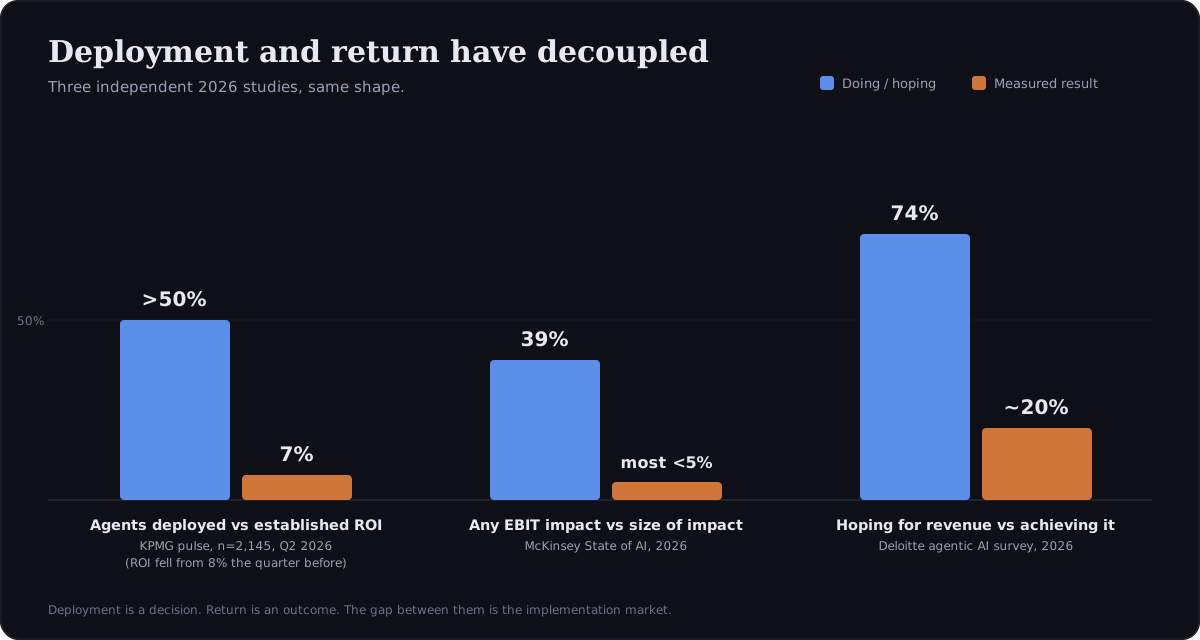
Three independent studies from 2026, one shape:
- KPMG's AI quarterly pulse survey (n=2,145 leaders, Q2 2026): agent deployment held above 50% while "established, measurable ROI" fell from 8% to 7% quarter over quarter. In the same survey roughly a quarter of organizations scaled back agent deployments, about 24% delayed or paused, and about 22% questioned them, mostly because expected costs outweighed value.
- McKinsey's State of AI (2026): 39% of organizations report any EBIT impact from AI, and most of those put it under 5% of EBIT.
- Deloitte's agentic AI research (2026): 74% hope AI agents will grow revenue; about 20% report achieving it.
Two more results calibrate how big the perception gap is. METR's randomized controlled trial (2025) gave experienced open-source developers AI tools on real tasks in repositories they maintain: tasks took 19% longer (95% CI 1.3% to 39.4%, n=16), while the developers forecast a 24% speedup beforehand and still believed they had been 20% faster afterwards. And a JAMA Network Open trial (Goh et al., 2024, n=50 physicians) found GPT-4 alone outscored physicians on diagnostic reasoning by 16 percentage points, while physicians given GPT-4 improved by a statistically insignificant 2. The tool being good is not the same as the tool helping, and self-reported productivity gains are not evidence.
The famous counterpoint, "95% of AI pilots fail", is a misreading of its own source. MIT NANDA's July 2025 report (mirrored copy, the report never had a stable public home) actually says 95% of organizations could not point to measurable P&L return within six months, and its own funnel for task-specific GenAI tools shows 60% investigated, 20% piloted and 5% in production, which is a 25% pilot-to-production rate. The same report found general-purpose chatbots convert pilot to implementation about 83% of the time. Zero measured return and failed pilots are different facts, and the difference is where the money is.
Why it fails: the join, not the brain
Independent research keeps converging on the same named causes, and model capability is not among them.
| Evidence | Finding | Source, date |
|---|---|---|
| Enterprise app integration | Only 27% of enterprise applications are connected, down from 29% a year earlier, while the average enterprise runs 897 applications. 86% of IT leaders say that without integration, agents add complexity rather than value | MuleSoft Connectivity Benchmark, n=1,050 IT leaders, 2026 |
| Scaling blockers, India | 53% cite integration complexity with core systems as the top blocker; over half convert under 10% of GenAI pilots to production | EY India, n=200+, 2026 |
| Root causes of AI project failure | Most cited: leadership misunderstanding or miscommunicating the problem. Second: data quality (30 of 50 industry interviewees). Skills shortages rank last on Fivetran's blocker list at 33% | RAND RR-A2680-1, 65 interviews, Aug 2024; Fivetran, 2024 |
| Run cost | Inference cost per agentic workflow rises more than fivefold through 2028 | Gartner, Aug 17, 2026 |
| What high performers do differently | Fundamental workflow redesign: 55% of high performers vs 20% of the rest, a 2.8x gap, the strongest differentiator in the study | McKinsey State of AI, 2026 |
| Project size | Small, scoped projects succeed ~10x more often: 61% success and 7% failure for small vs 6% and 43% for grand projects | Standish CHAOS, 25,000+ projects, 2015 |
Read together: the thing that fails is not the model and not the idea. It is the join between systems, the process nobody defined and the run cost nobody modelled. That matches what we see in production work exactly. Of the 12 ways Make.com scenarios fail that we documented from 1,200+ builds, most produce green runs with wrong data: no error handler, unhandled pagination, missing idempotency, silent schema drift. The failure mode of automation is silence, not sirens. It is also why the winning engagement pattern in our own client work is narrow scope first: one process, error handling included, shipped in days, exactly the shape the Standish data says succeeds ten times more often, and why an audit that defines the process and picks the platform comes before any build worth paying for.
One court case puts a price on skipping the discipline. In Moffatt v. Air Canada (2024 BCCRT 149), a tribunal held the airline liable for its own website chatbot inventing a refund policy, rejecting the argument that the chatbot was a separate entity. The award was small, CAD 812.02. The precedent is not: your automation's output is your company speaking.
The builder paradox: users multiply, builders shrink
The strangest verified fact in this industry: the technology is spreading while the population paid to build with it contracts.
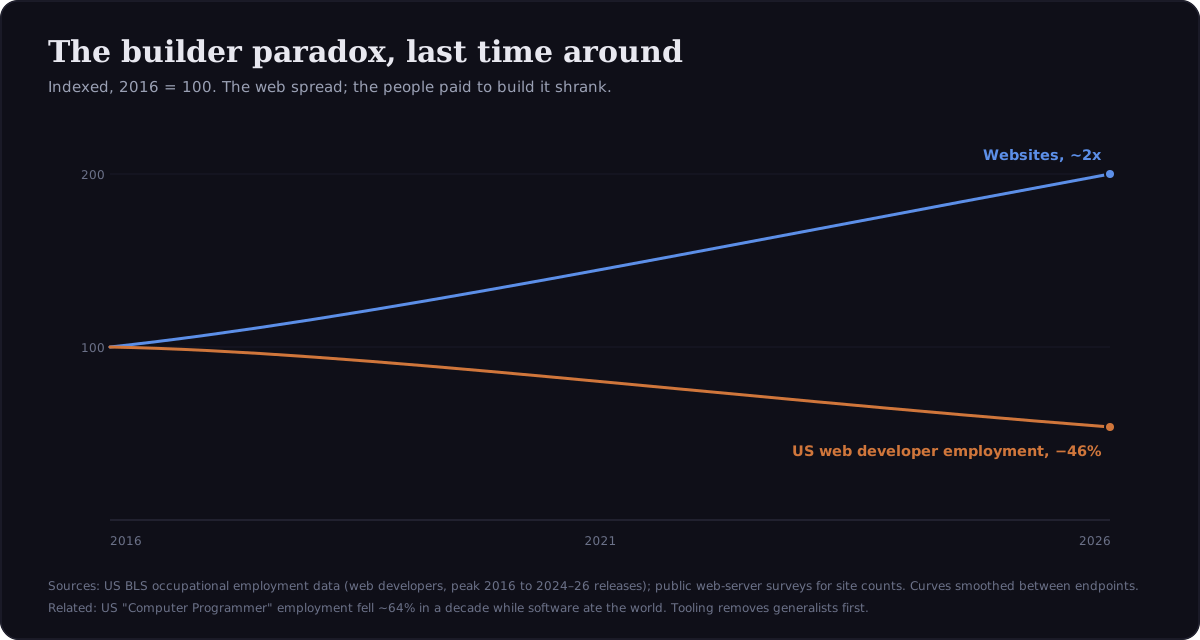
Every prior platform did this. US web developer employment fell about 46% from its 2016 peak while the number of websites roughly doubled (US BLS occupational employment data; public web-server surveys). US "Computer Programmer" employment fell about 64% in a decade while software ate everything. The top 1.6% of app developers out-earned the other 98.4% combined. Better tooling does not remove specialists, it removes generalists, and it concentrates the remaining paid work in fewer, deeper hands.
The freelance marketplaces show the same consolidation from the demand side: Fiverr's active buyer count fell 21% while spend per buyer rose 16%, and Upwork's active clients fell 4% while gross services volume per client hit a record (both from company earnings disclosures, 2025 to 2026). Fewer buyers, bigger tickets. The DIY wave is real, and it is not the professional's competition. People who would never have paid anyone now build their own fragile automations; the ones who pay are the ones for whom failure is expensive. That population is not growing in number, it is growing in budget per head.
The academic anchor for all of this is Comin and Mestieri (AEJ: Macroeconomics, 2018, peer reviewed): technology adoption lags have converged across countries while intensity of use has diverged. Everyone gets the technology at roughly the same time now. Nobody uses it equally well. The divergence is the implementation market.
And for calibrating the next decade, the best comparison is not the smartphone, it is e-commerce: US retail e-commerce went from 16.1% of retail in Q2 2020 to 16.9% in Q1 2026 (US Census retail data). The biggest forced behaviour change in modern commerce moved the share 0.8 points in six years. Access converges fast. Effective use grinds.
The debunk table: eight viral numbers, checked
Every entry names the claim, what the checkable sources say and what to say instead. Steal the table, it is the point of the report.
| The viral claim | What is checkable | Say instead |
|---|---|---|
| "Only 0.04% of people pay and build with AI" (the 2,500-dots graphic) | Its paid tier undercounts OpenAI's own 50M+ consumer subs plus Microsoft's 15M+ seats by 2 to 10x; its builder tier is smaller than GitHub Copilot's paid base alone (4.7M); its "84% never used AI" counts 2.2B people with no internet | ~1.5% of connected people pay for AI; ~0.1 to 0.2% pay for building tools |
| "95% of AI pilots fail" | MIT NANDA (Jul 2025) says 95% of organizations saw no measurable P&L return in 6 months; its own funnel shows a 25% pilot-to-production rate for task-specific tools and ~83% for general chatbots | "95% could not show measured return within six months" |
| "RAND: 80% of AI projects fail" | The 80% line appears in RAND's report but is not RAND's own finding; the report's contribution is the ranked causes, led by leadership misunderstanding the problem | Cite the causes, not the invented base rate. No probability-sampled base rate exists anywhere |
| "Only 3% pay for AI" | US-scoped: Menlo measured ~3% of US AI users paying (Apr 2025) and Bank of America ~3% of US households (2026). Not a global figure | "~3% of US users pay" with the source, or the global ~1.5% of connected people |
| "Claude has 245M monthly users" | Anthropic has never disclosed consumer MAU. The figure is an aggregator invention. Company-stated run-rate is $30B (Apr 2026); $47B is a Sacra estimate | Quote only company-stated figures, labelled |
| "Zapier has 10M+ users" | Verifiable: 3M+ users, 100K+ paying customers | 3M+ users, 100K+ paying |
| "AI adds $15.7 trillion by 2030" (PwC) | A 2017 forecast in 2016 prices, prefixed "up to", $9.1T of it consumption demand, not productivity. Meanwhile ten-year tech adoption forecasts score ~4 hits against 14 clean misses when checked | Trust one-year spend forecasts, distrust ten-year adoption forecasts |
| "AI automation demand grew 900% YoY" | Could not be traced to its claimed source. Dead stat | Do not use |
If a number arrives without a metric, a date and a named source, it is content, not data. The stat-aggregator sites that dominate search results for these queries cite each other in circles; go to the vendor disclosure, the survey PDF or the earnings call every time.
What this means if you run a business
The verified numbers point to five decisions:
- Automate narrow, then widen. Small scoped projects succeed about ten times more often than grand ones (Standish, 2015). One process with error handling beats a transformation program you cannot finish. The economics per process are in our business automation cost guide.
- Buy the join, not the sparkle. Integration and process definition are the measured failure points, not model capability. Before choosing tools, map the process; before agents, connect the systems. This is precisely what an automation audit is for, and why it comes before any build quote worth trusting.
- Model run cost before you scale. Gartner projects agentic inference costs rising more than fivefold through 2028, and cost is already the top reason organizations scale back (KPMG, 2026). A scenario that polls when it could listen, or an agent that reasons when a lookup would do, is a monthly bill you chose. The mechanics are in our guide to AI agents vs automation.
- DIY where failure is cheap, hire where it is expensive. The DIY tools are genuinely good now. The dividing line is the cost of a silent failure: if wrong data in that process costs real money, you want the discipline documented in the 12 failure modes, built in from day one.
- If you hire, verify. The builder pool is consolidating, which means credentials matter more, not less. Certification levels and partner directories are checkable in minutes; the method is in our hiring guide.
FAQ
What percentage of people actually pay for AI in 2026? Roughly 1.5% of people online, about 70 to 100 million unique payers worldwide in mid 2026, anchored by OpenAI's 50M+ consumer subscriptions (Feb 2026) and Microsoft's 15 to 20M paid Copilot seats (2026 earnings). Among people who actively use AI, 5 to 7% pay.
Is the "95% of AI pilots fail" statistic true? No. Its source, MIT NANDA's July 2025 report, found 95% of organizations could not show measurable P&L return within six months, while its own data shows about 25% of task-specific pilots reaching production and about 83% of general chatbot pilots converting. Zero measured return and failed pilots are different claims.
What share of businesses use AI in 2026? In the US, 55.7% of firms pay for AI products (Ramp card data, Jul 2026) and 21.6% report using AI in production (Census BTOS, Jul 2026). Both are true, they measure different things. Large firms (250+ staff) are near 37%; firms under 20 employees showed no significant growth from Dec 2025 to May 2026.
What is the most common reason AI automation projects fail? The measured causes are leadership misunderstanding the problem (RAND, 2024), data quality, integration (only 27% of enterprise apps are connected per MuleSoft 2026, and 53% of Indian enterprises name integration complexity as the top blocker per EY) and unmodelled run cost (KPMG, 2026). Skills shortages rank last. In our own production work the most common technical failure is a scenario with no error handling that runs green while losing data.
What is the most expensive myth in AI automation? The grand-transformation project. Standish's 25,000-project dataset puts grand projects at 6% success and 43% failure against 61% and 7% for small scoped ones. Buying a big program because the forecast decks are big is how deployment without return happens.
Will AI automation replace automation consultants? The web is the precedent: websites doubled from 2016 to 2026 while US web developer employment fell about 46% (BLS). Tools removed generalists and concentrated paid work in specialists who handle the expensive failures. The same consolidation is visible in Fiverr and Upwork's own numbers, fewer buyers paying more per head. Fewer builders, deeper work, higher stakes per engagement.
How much of AI adoption forecasts should I believe? Trust one-year spend forecasts, they have tracked within a few percent. Distrust ten-year adoption forecasts: scored against reality, analyst ten-year calls produced about 4 clean hits and 14 clean misses, and PwC's famous $15.7 trillion figure is a 2017 estimate prefixed "up to". The only ten-year trend measured rather than forecast is that access converges while effective use diverges.
Compiled from vendor disclosures, earnings calls, named surveys and peer-reviewed studies, cross-checked August 2026. If you find an error with a source attached, tell us and we will correct the number and credit you. If your own automation is in the deployed-but-no-return column, the fit-check takes two minutes and the answer is honest either way.